Tag: Business Analytics
 http://andavisolutions.com/wp-content/uploads/2022/02/andavi-horizontal.svg
0
0
Jim Thompson
http://andavisolutions.com/wp-content/uploads/2022/02/andavi-horizontal.svg
Jim Thompson2014-11-05 08:00:212023-02-09 12:12:24SQL Pass Demos Power BI and Power Query – looking good!
http://andavisolutions.com/wp-content/uploads/2022/02/andavi-horizontal.svg
0
0
Jim Thompson
http://andavisolutions.com/wp-content/uploads/2022/02/andavi-horizontal.svg
Jim Thompson2014-10-29 08:00:392023-02-09 12:17:40ViewPoints 2015 Event Planning begins!
http://andavisolutions.com/wp-content/uploads/2022/02/andavi-horizontal.svg
0
0
Jim Thompson
http://andavisolutions.com/wp-content/uploads/2022/02/andavi-horizontal.svg
Jim Thompson2014-10-01 08:00:272023-02-09 12:43:58Happy Anniversary Business Impact!
http://andavisolutions.com/wp-content/uploads/2022/02/andavi-horizontal.svg
0
0
Jim Thompson
http://andavisolutions.com/wp-content/uploads/2022/02/andavi-horizontal.svg
Jim Thompson2014-11-05 08:00:212023-02-09 12:12:24SQL Pass Demos Power BI and Power Query – looking good!
http://andavisolutions.com/wp-content/uploads/2022/02/andavi-horizontal.svg
0
0
Jim Thompson
http://andavisolutions.com/wp-content/uploads/2022/02/andavi-horizontal.svg
Jim Thompson2014-10-29 08:00:392023-02-09 12:17:40ViewPoints 2015 Event Planning begins!
http://andavisolutions.com/wp-content/uploads/2022/02/andavi-horizontal.svg
0
0
Jim Thompson
http://andavisolutions.com/wp-content/uploads/2022/02/andavi-horizontal.svg
Jim Thompson2014-10-01 08:00:272023-02-09 12:43:58Happy Anniversary Business Impact!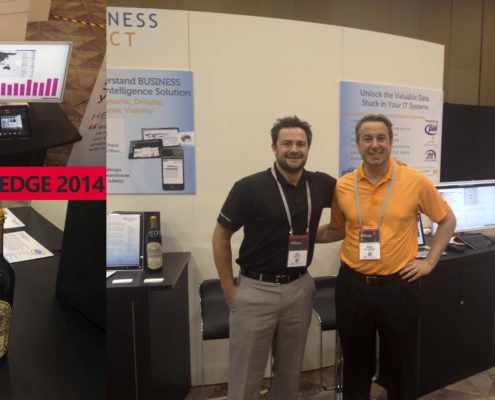 https://andavisolutions.com/wp-content/uploads/2023/02/ApteanEdge2014-Exhibit-scaled.jpg
1306
2560
Jim Thompson
http://andavisolutions.com/wp-content/uploads/2022/02/andavi-horizontal.svg
Jim Thompson2014-06-02 08:00:222023-02-09 12:47:07Aptean BI – Business Intelligence Review
https://andavisolutions.com/wp-content/uploads/2023/02/ApteanEdge2014-Exhibit-scaled.jpg
1306
2560
Jim Thompson
http://andavisolutions.com/wp-content/uploads/2022/02/andavi-horizontal.svg
Jim Thompson2014-06-02 08:00:222023-02-09 12:47:07Aptean BI – Business Intelligence Review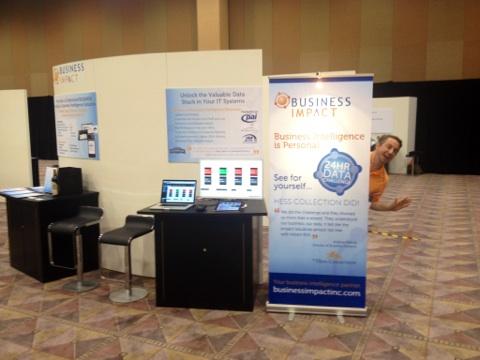 https://andavisolutions.com/wp-content/uploads/2023/02/IMG954914.jpg
360
480
Jim Thompson
http://andavisolutions.com/wp-content/uploads/2022/02/andavi-horizontal.svg
Jim Thompson2014-05-21 08:00:102023-02-11 12:14:22Aptean Edge Review – From Behind the Sign
https://andavisolutions.com/wp-content/uploads/2023/02/IMG954914.jpg
360
480
Jim Thompson
http://andavisolutions.com/wp-content/uploads/2022/02/andavi-horizontal.svg
Jim Thompson2014-05-21 08:00:102023-02-11 12:14:22Aptean Edge Review – From Behind the Sign https://andavisolutions.com/wp-content/uploads/2023/02/MarketBasket-2.jpg
613
956
Jim Thompson
http://andavisolutions.com/wp-content/uploads/2022/02/andavi-horizontal.svg
Jim Thompson2014-04-02 08:00:402023-02-11 12:34:08Convenience Stores Perform Market Basket Analysis To Increase Profitability
https://andavisolutions.com/wp-content/uploads/2023/02/MarketBasket-2.jpg
613
956
Jim Thompson
http://andavisolutions.com/wp-content/uploads/2022/02/andavi-horizontal.svg
Jim Thompson2014-04-02 08:00:402023-02-11 12:34:08Convenience Stores Perform Market Basket Analysis To Increase Profitability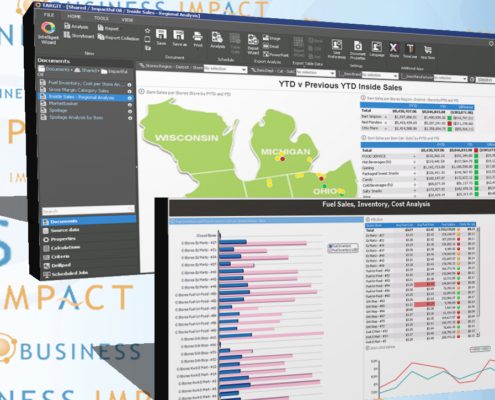 https://andavisolutions.com/wp-content/uploads/2023/02/Convenience-InsideSales-Recovered.jpg
725
1008
Jim Thompson
http://andavisolutions.com/wp-content/uploads/2022/02/andavi-horizontal.svg
Jim Thompson2014-03-27 08:00:032023-02-11 12:39:03Take Control of Your Convenience Store Purchasing Data
https://andavisolutions.com/wp-content/uploads/2014/03/Copy-of-Home-Page.png
890
1672
Jim Thompson
http://andavisolutions.com/wp-content/uploads/2022/02/andavi-horizontal.svg
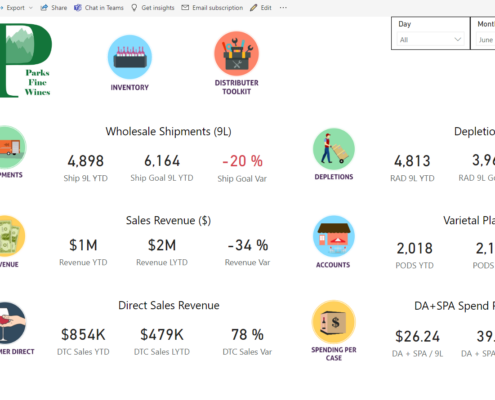
Jim Thompson2014-03-12 08:00:382023-06-20 11:22:01Wine Depletion Data and its Influence on the 3 P’s
https://andavisolutions.com/wp-content/uploads/2023/02/Convenience-InsideSales-Recovered.jpg
725
1008
Jim Thompson
http://andavisolutions.com/wp-content/uploads/2022/02/andavi-horizontal.svg
Jim Thompson2014-03-27 08:00:032023-02-11 12:39:03Take Control of Your Convenience Store Purchasing Data
https://andavisolutions.com/wp-content/uploads/2014/03/Copy-of-Home-Page.png
890
1672
Jim Thompson
http://andavisolutions.com/wp-content/uploads/2022/02/andavi-horizontal.svg
Jim Thompson2014-03-12 08:00:382023-06-20 11:22:01Wine Depletion Data and its Influence on the 3 P’s